Search in ideas for "LTC CHART"

LTC moveNote: All links of the article are provided at the end of the page
LTC exhibited a distinctive trading pattern within a parallel channel, characterized by the formation of successive Higher Highs and Higher Lows. This structural arrangement, indicative of a bullish trend, was elaborated upon in the preceding analysis, accessible by clicking here. In that same discourse, I expounded upon LTC’s confinement within a horizontal trading range. The momentous juncture occurred when LTC breached the crucial support level at $85. This pivotal event was meticulously detailed in our analysis, prompting the identification of a revised target at $73, an objective that was notably attained. Let us now delve into the unfolding dynamics as captured within the fresh tapestry of LTC’s charts.
Primarily, LTC charted an abrupt departure from its prior trajectory, resulting in the breach of both its upward channel and the horizontal support it had hitherto clung to. This marked descent culminated in a nadir of approximately $55. Yet, it merits highlighting that LTC managed to secure a daily close slightly above the $63 support threshold, presently maintaining this tenuous foothold. The salient observation amidst these shifts pertains to LTC’s definitive departure from the Higher Highs and Higher Lows schema. The disruption of this intricate framework precipitates a transformation in LTC’s overall outlook, transitioning it into bearish territory. A pertinent antecedent to this transformation was illuminated in an antecedent discourse, analyzing LTC’s price behavior subsequent to the 2019 halving event. For an in-depth exploration, the concerned article can be accessed here.
A cursory glance at the Fibonacci retracement chart underscores LTC’s trajectory below the 0.618 Fibonacci level, a descent that extended to breach the 0.78 mark as well. Nonetheless, as the trading day culminated, LTC exhibited resilience by surmounting the 0.78 threshold. Presently, this level serves as a tentative support base. However, an acute cognizance of the prevalent market sentiment is imperative, a theme extensively dissected in the preceding article, accessible for review here. The prevailing sentiment climate is discernibly bearish, and juxtaposed with LTC’s already established bearish trajectory following the rupture of its Higher Highs and Higher Lows pattern, the likelihood of a further breach of the aforementioned support remains palpable. This apprehension is fortified by the RSI for LTC, languishing within the oversold spectrum, alongside the ominous presence of a bearish crossover within the MACD. Both these indicators converge to intimate a bleak sentiment projection for LTC.
Within the current context, preserving LTC’s perch above the $63 level emerges as a paramount consideration. A breach of this resistance juncture would inevitably beckon a re-visitation of price targets, prognosticating levels of $55.5, $50.5, and $48. As these conjectures are meticulously weighed against the backdrop of past price oscillations, they coalesce into anticipated trajectories for LTC in the forthcoming September of 2023.
click here to checkout the latest articles on our website
LTC previous article: cryptonewsbytes.com
sentimental analysis: cryptonewsbytes.com

Litecoin Daily Chart... Weakness for sureBeing completely objective with the chart here but LTCUSD looks horrible in comparison to the other crypto charts. BTC, ETH and a ton of shitcoins have all broken out of the multi month downtrend channel that started back at the all time highs. Most have had bullish MACD crosses and are above or at least challenging their 50/200 DMA. Can't say anything like that is present in the current LTC charts. Still below both the 50 and 200 DMA, which is also weaker than most of the other crypto charts. This descending triangle looks and feels like it might break to the downside here and we'll see $100 LTC again.
You can make a bullish case that this is the 4th time LTC has touched the breakout point in the triangle, it's due to bust out..... maybe... but where is it? It should have happened already. If LTC doesn't pop out of this triangle soon, It's most likely going lower.
I guess if you had to make a bullish case for LTC and say that in the recent downtrend, it never had a death cross (200 DMA crossing below the 50 DMA). You could possibly show that LTC did hold up better during bearish phases in the past. I agree that many times LTC does display relative strength when the overall crypto markets get in trouble.
Bottom line, needs to bust out of this downtrend channel... like BTC and many other cryptos have done. LTC is late to the crypto rally and has the weakest chart out of the top tier cryptos.
What do you think? Please let me know below?

Gloom And Doom Fills The Room! Litecoin! (LTC) Master Analysis! Hi friends! In an attempt to give my lovely viewers a heads up, on the potential dangers of this market, I would like to share this gloomy, yet very realistic analysis with you.
Now, let's take a look at Litecoin! Looking at the four hour chart, we can see that Litecoin has rallied significantly off of Wednesday's low, but don't get too excited just yet. LTC tried to rally above the "critical resistance" level, and periodically broke above, only to quickly reverse back to the downside. On the chart, we can see that LTC is also failing to get above the top of the downtrend channel (grey dots.) Thus far, LTC has produced two failed attempts to break above. Looking at the volume, we can see that it has dropped significantly, indicating exhaustion in the bulls. Additionally, the MACD looks like it wants to level out.
I'm sure you've all noticed, that I've drawn a big bear flag over the recent price action (black flag.) I've noticed several other bear flags, in BTC, ETH, and many other cryptos, but some of the flags are not that easy to distinguish. However, most cryptos are currently trading in synchrony, so they're producing similar patterns on the charts. Looking at LTC, it appears as though the bear flag may already be breaking to the downside. It isn't an extremely clear bear flag pattern, but I believe it is a bear flag nonetheless. As I was doing this analysis, I noticed something profoundly interesting. If you recall from my older LTC charts, when the all time high was made, and it formed that big head and shoulders pattern (top left,) my analysis showed that LTC could eventually fall to about $106. When I saw that, I put a "head and shoulders target" of $105.94 on my chart. Immediately, I was inundated with hateful responses from people who were telling me that I was an idiot, and that technical analysis didn't apply to crypto charts. Today, looking at this potential bear flag pattern, we can see that it's price target aligns perfectly with the price target of the head and shoulders pattern. Incredible! Suddenly, $106 doesn't seem so unrealistic. Technical analysis can often come together in the most beautiful ways — i believe, because markets are fractal in nature. I'm not saying for sure that we will get down there. I'm just saying that based on the structures formed on this chart, that is the likely target area. On the downside, initial support rests at the pink trendline. Below tat, there support levels are sparse and relatively insignificant. On the upside, there is major overhead resistance. We have the critical level (red dots,) the top of the falling parallel channel (grey dots,) the 50 EMA (in orange,) the 61.8% retracement level, and the 200 EMA (in purple.) Clearly, the path of least resistance is to the downside. That isn't to say that it's impossible for LTC to rally higher from here. I'm just presenting solid evidence, to show that a continuation higher is very unlikely.
This has been your not-so-humble market wizard, droppin' knowledge like bombs in this place! Please follow, comment, like, and share on social media! Good luck trading everyone.
***This information is not a recommendation to buy or sell. It is to be used for educational purposes only.***
-MPC loves you-
-JD-

Litecoin Breakout: Potential Gains and ProfitsAlright, let’s talk about Litecoin and why I think it’s gearing up for something big. The market's been showing solid gains across the altcoin sector , and Litecoin is definitely catching my eye right now.
Here’s the deal: the LTCBTC pair looks like it’s finally bottomed out and is breaking out of a two-year downtrend line . If that sounds familiar, it’s because we’ve seen this before. Back in 2017 , Litecoin broke out of a similar downtrend, and the result? LTCUSD skyrocketed from $8 to $365 in just a year .
Fast forward to today — 2023 and 2024 have been all about consolidation in the $100–$47 range . Now that we’ve broken through $135 , 2025 could be a massive year for Litecoin. My main target is $365 , but I’ve got my eye on some optional targets at $630 and even $1,300 .
Why those higher targets?
Simple. Looking at how the LTCBTC pair has performed in the past, even a small upward move there has historically triggered huge gains in LTCUSDT .
Now, let’s break it down further.
Litecoin’s price history shows recurring patterns — ascending triangles from 2015 to 2017 and now again from 2018 to 2025 . And these patterns play out in phases:
🔴 Downtrend
🟡 Consolidation
🟢 Breakout
We’ve already seen this cycle happen three times — 2014 to 2018 , 2018 to 2021 , and now 2021 to 2025 . It’s all lining up again.
The key now is to watch the details . Resistance levels, price action , and how the breakout unfolds will be crucial. If Litecoin follows through, it could be gearing up for a move that redefines its place in the market .
Stay tuned — this could get really exciting.🍻
Some of past LTC charts:

LTC Marketcap Sitting at the PCZ of a Logscale Deep GartleyWe have 0.886/1.618 confluence at around 3.5-3.3 Billion Dollars and are currently Banging up against a Trendline that if we break above could be the start of something big. I'v already got some other bullish charts on LTC charted in different ways and everytime and every way i look at the ltc charts i just see huge amounts of bullish potential and i'm just adding this chart to the growing list of bullish charts on LTC. The other LTC charts can be seen in the Related Ideas Tab below.

LTC Litecoin: Prior Cycles ReviewHello friends, today you can review the technical analysis idea on a 1W linear scale chart for Litecoin (LTCUSD).
The chart is self-explanatory. I am reviewing the current and two prior cycle moves and reviewing the Fibonacci Retracement tool at the 0.618 and 0.5 areas (dead cat bounce zones). Assuming history repeats itself, the price has a potential to get back over $200 before moving back down. This is on the weekly chart so have patience, and anything is possible as history does not need to repeat itself.
I have various LTC charts in the related ideas below. Check them out as well!
If you enjoy my ideas, feel free to like it and drop in a comment. I love reading your comments below.
Disclosure: This is just my opinion and not any type of financial advice. I enjoy charting and discussing technical analysis . Don't trade based on my advice. Do your own research! #cryptopickk

Doge'll be comin' round the mountain when Doge does...Definitely in a bull cycle, which appears to be halfway done, and if it's anything similar to the only other bull cycle Doge has ever had... shall I say anywhere from $28 to $50; lets see where wonderland takes us, ha. The yellow checkmarks align with the below chart to denote how similar Doge has moved with respect to Bitcoin since launch, and it also denotes how similar ETH (green), ADA (blue), LTC (turquoise), and XMR/Monero (orange) have moved with respect to Bitcoin as well... weird how many of the top coins do this. I have no specific timing other than I'm expecting for the current crypto bull cycle to have wrapped up by the end of Q2 of next year. And that I hope for things to be wrapped up, at latest, by February... but we shall see.
BTC Chart:
ETH Chart:
ADA Chart:
LTC Chart:
XMR Chart:

WYCKOFF ON THE LIVE LTC CHARTFirst of all, this is not financial advice. This chart includes only my idea of where we are going.
I am seeing Wyckoff on the chart. Just i couldnt be sure SOW and LPSY area. so there is 2 way to where ltc is heading in my view..
Not: I am not proffessional charter. But this chart looks valid to me. I wanted to share because we may discuss or take some different wiev from each other.
Second thing is, All day we are trying to handle fuds fuds fuds. I DONT BLIEVE FUDS and silly news. So i charted this.
I BLIEVE MATH, CHARTS and ALGORITHM.
Thanks.

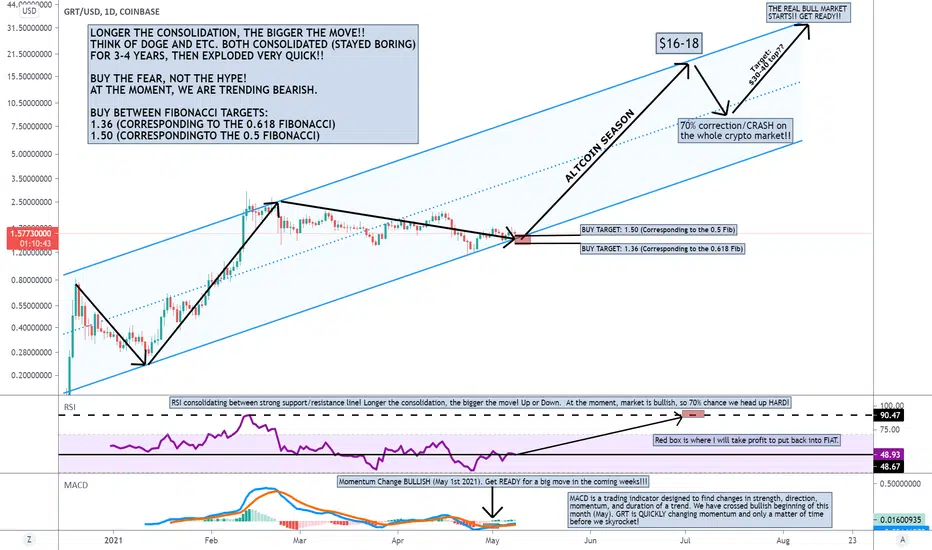
GRT Update: Short term bearish, but Momentum changed in MACD!!FACTS:
1. Just as Google indexes the web, The Graph indexes blockchain data from networks.
2. Can buy in the BIG exchanges like Coinbase, Binance, and Kucoin.
3. Longer the CONSOLIDATION, the bigger the move. Think of DOGE. Consolidated in a range
for 3-4 years, then exploded over over 1000x. Don't buy the hype, buy the fear and Cryptocurrencies that haven't moved yet!!
Market Cap: 1.9 Billion (HIGHLY UNDERVALUED!)
Total Supply: 10 BIllion
Everything is on the chart! GRT is on the verge of exploding higher. Dips/Corrections are normal and are needed in a bull market, and are BUYING OPPORTUNITIES! HUGE GAIN opportunity in the coming months!!. Buy targets are between the Fibs (shown in the chart). On the chart, the RSI is bouncing off strong support resistance from the past and we are CLEARLY OVERSOLD... MACD changed momentum to bullish on May 1st. GRT is about to make a big move right after the correction that will happen VERY SOON. NEVER TRADE BLINDLY. USE MULTIPLE INDICATORS TO MAKE CALCULATED DECISIONS. TRADE WITH NO EMOTIONS!!
CHARTS DON'T LIE!! Small/Mid size Corrections will happen on this journey to $5000 which corresponds to the Fibbonacci target in the next couple of months! Once target is met, a HUGE CORRECTION (maybe 70% dip) will occur. Take profit and buy again for the REAL bull run to begin!
My last LTC chart:
Check out the Altcoin season chart below (Crypto Total Market Cap Excluding BTC ). We are on the verge of another altcoin super cycle
Altcoin Season is just getting started!! BULLISH CROSS on weeky!
Bitcoin dominance will die down and Altcoins will take over!! Whales/bots/institutions will be moving their Bitcoin ( BTC ) into the Altcoins, meaning Altcoin Season is just getting started.
Money flows like this:
FIAT > BITCOIN > LARGE MARKET CAP COINS > MIDDLE MARKET CAP COINS > SMALL MARKET CAP COINS > back to FIAT, and the cycle starts again.
I have moved majority of my BTC and diverse them into different altcoin positions. (ETH, HBAR, GRT , XLM , XRP, NEO, SNX , BNT, BCH, ADA, LTC, BTMX, LINK, FORTH, BTMX, and NKN are the some of the altcoins I am moving BTC too).
Get ready to have an explosive Altcoin season just like what happen in the 2017 bull market. Once my sell indicators hit, I will be selling my positions to buy real estate, a lambo ;) , and moving the rest to Ethereum to Stake it!
Good Luck!
"If you can't beat the fear, do it scared!"
"Be fearful when others are greedy, and greedy when others are fearful!" - Warren Buffet.
"Markets are a device for transferring money from the impatient to the patient. - Warren Buffet
"Show me the charts, and I'll tell you the news." - Bernard Baruch
LTC Update: About to go Parabolic in the coming months!! Everything is on the chart! LTC is on the verge of exploding higher. Dips/Corrections are normal and are needed in a bull market, and are BUYING OPPORTUNITIES! HUGE GAIN opportunity in the coming months!!. On the chart, Stochastic RSI is about to cross on the weekly again. We need confirmation end of the week. RSI is clearly oversold on the weekly! NEVER TRADE BLINDLY. USE MULTIPLE INDICATORS TO MAKE CALCULATED DECISIONS. TRADE WITH NO EMOTIONS!!
Once DOGE and ETC cools down (in Robinhood), LTC and BCH will start running hard next and will be copying DOGE and ETC moves soon! (TIP: Both are traded on Robinhood, lets sink that in your head) ;) (FIB Level buys are between 300-334)
CHARTS DON'T LIE!! Small/Mid size Corrections will happen on this journey to $5000 which corresponds to the Fibbonacci target! Once target is met, a HUGE CORRECTION (maybe 70% dip) will occur. Take profit and buy again for the REAL bull run to begin!
My last LTC chart:
Check out the Altcoin season chart below (Crypto Total Market Cap Excluding BTC ). We are on the verge of another altcoin super cycle
Altcoin Season is just getting started!! BULLISH CROSS on weeky!
Bitcoin dominance will die down and Altcoins will take over!! Whales/bots/institutions will be moving their Bitcoin ( BTC ) into the Altcoins, meaning Altcoin Season is just getting started.
Money flows like this:
FIAT > BITCOIN > LARGE MARKET CAP COINS > MIDDLE MARKET CAP COINS > SMALL MARKET CAP COINS > back to FIAT, and the cycle starts again.
I have moved majority of my BTC and diverse them into different altcoin positions. (ETH, HBAR, GRT , XLM , XRP, NEO, SNX , BNT, BCH, ADA, LTC, BTMX, LINK, FORTH, and NKN are the some of the altcoins I am moving BTC too).
Get ready to have an explosive Altcoin season just like what happen in the 2017 bull market. Once my sell indicators hit, I will be selling my positions to buy real estate, a lambo ;) , and moving the rest to Ethereum to Stake it!
Good Luck!
"If you can't beat the fear, do it scared!"
"Be fearful when others are greedy, and greedy when others are fearful!" - Warren Buffet.
"Markets are a device for transferring money from the impatient to the patient. - Warren Buffet
"Show me the charts, and I'll tell you the news." - Bernard Baruch

Moonsie's Long-term Litecoin View | #1 - Accumulate, you fools!Moonsie's Long-term Litecoin View | #1 - Accumulate, you fools!
In the past, I published many nonsense, low-level LTC charts and ideas. I did that because I didn't really take tradingview and/or charting seriously - it was just a pathetic pastime of mine. Most of those charts were bearish, and most of them turned out to be correct (even though I rarely short - Litecoin, cryptocurrencies in in general, are a long-term investment for me. I have tried day trading and trading "the big swings", but it turns out I perform better just holding, even if that means painful "what iffs" after the bull dies off and the bear ensues. I can take it).
However, those charts might not have been perceived well. What I don't take seriously, another might. I want to erase all doubts and prevent further possible future confusion, so from now on, I will only publish charts and ideas I actually stand behind. It's also part of my belief of good thoughts, good words, and good deeds. Computers connect, but they also create an emotional distance; it's important we don't forget real people with real emotions have created and will continue to create all the content that is available online.
Enough of that. My first serious chart, which will be part of a series called " Moonsie's Long-term Litecoin View ". Moonsie is the username I usually go by on Telegram; someone has hijacked by handle though. The current @moonsie is a faker, and not I.
#1 - Accumulate, you fools!
I expect the $21 support level to hold because LTC has already overly corrected, especially when you take the indicators mentioned in the chart and below into account. Furthermore, a drop to $21 (first support level) from current level of $23.50 equals a 10,6 percentage drop. Current BTC price is $3355 - a drop to $3k, which is "the" bottom according to many, is, coincidence or not, also a 10,6% drop. Even if this support level does not hold, I would not bet on the $16,82 support level breaking. It might be tested, but most likely followed by a high-volume breakout shattering all the close resistance lines in its path.
RSI: Lowest weekly RSI ever recorded. Even lower than 2015 January capitulation week.
MACD Crossover: Watch out for a MACD crossover. In simple terms; blue line crossing over orange line signals reversal. Just as the orange line crossing over the blue line back in January signalled the beginning of pain and misery, and pain and misery indeed came. Orange line basically can't go much lower, it's a matter of mere days for the crossover to happen. Tiny bit of lacking indicator, so don't wait to buy for the crossover to happen - BUY NOW.
Most of the things mentioned above are purely technical analysis, keep in mind Litecoin has a lot more going for it, to a name a few things:
The next halvening is just months away. Don't be an idiot who starts accumulating days in advance. Accumulate now.
"The flappening"; BCash Shit & BCash Shit 2.0 ("SV") are dying - Litecoin market cap will rise above the market cap of these 2 scam coins before the year's end. A lot of capital will flow into Litecoin, which, if you think about it, is really the only true 'bitcoin cash' (crypto cash).
Litecoin active development going on.
Litecoin Foundation and its creator, Charlie Lee, are everywhere and contribute significantly to the crypto-ecosystem as a whole. There are many partnerships, ongoing projects, planned projects, and so on.
A fundamentally strong coin. Unlike literally all the other cryptocurrencies in existence, LTC did not have a premine, token sale, ICO, etc. It's creator is transparent and it is one of the only truly decentralised coins with high liquidity and a trackrecord of surviving the most brutal bear markets in crypto-history.
Buy now or cry later :).

Way Too Early To Call The Bottom — BITCOIN! (BTC)Hi friends! Welcome to this update analysis on Bitcoin! Well, as you can see, yesterday's formation still appears to be a bear flag, as opposed to the clear looking V bottom formation seen on the LTC chart. Perhaps LTC has overreacted to the upside. Or, perhaps BTC is under-reacting. Looking at the MACD, we can see that a bullish crossover has occurred, and buy-side volume is exploding on the chart, as the bulls try to form a bottom in the bear market. With that said, I do think there is a decent chance, that the bottom could be in. However, there is one major thing that I need to see, to feel very confident about that statement, and put more bullish money to work. I want to see BTC break out above the downtrend channel, and particularly, I want to see it get above the "Heavy Resistance" level at the 50% retrace. Just above the current price action, is the 50 EMA (in orange.) It has been very resistive thus far, so it will be important to see how BTC responds to the 50 EMA, after this bottoming attempt. If we surpass the 50, it would be an indication that the bulls have some real momentum. Structurally, however, the bears will maintain control until the downtrend channel and the heavy resistance are surpassed.
Recently, I've been seeing some feedback in my comment sections, from people who are questioning my bullish post in LTC, while still having bearish targets in BTC and others. People were saying that it didn't make sense, and that it was stupid and so forth.
Well, here is the reasoning, which I've made very clear in all of my analyses. As I've stated, the targets that I produced on my charts, which were derived from measurements of structures, would only be reached if the respective structures retraced to 100% of their corrective potential. As you know, LTC reach the target. However, BTC, ETH, XRP and others, did not yet reached their targets. I've always said that bearish structures don't always retrace to 100% of their potential. Those statements are publicly available in my previous posts, and that concept is common knowledge in technical analysis. Likewise, bullish structures don't always break out to 100% of the breakout potential. Sometimes they do, and they go even farther. The point is, with each chart, I was simply trying to illustrate the maximum downside potential, based on the structures created on the chart. The current bounce is nice, and it could definitely be a bottom in the bear market. Or, it could be a dead cat bounce, before this market swallows the bulls like chunks of chicken soup. Personally, I'm long, but with very tight stops. I have seen way too many bear markets pop, only to quickly reverse and destroy the bulls. There is immense damage on this chart, and the majority of the resistance is to the upside. Don't let a little bounce, blind you into thinking the coast is clear. If you want to be bullish, theoretically, it would probably would be wise to exercise caution in your trades. Personally, I won't be a hardcore bull, until we get back above the heavy resistance.
This has been your not-so-humble market wizard, droppin' knowledge like bombs in this place! Please follow, comment, like, and share on social media. Good luck trading everyone!
***This information is not a recommendation to buy or sell. It is to be used for educational purposes only.***
-MPC loves you-
-JD-

LTC | ALTCOINS | BIG Gainer OR Sinking Ship?LTC has been on my watchlist for many, many months - much to my annoyance.
Compared to other altcoins such as DOGE, LTC is just not growing, and hasn't been for the better part of two years as it is unable to breakout above $110.
This we see evidently when we pull up the DOGE chart in comparison, and the BTC chart to really get an idea of just how bullish we are - a sentiment that is just not showing p on the LTC chart.
WHEN the TOTAL3 peaks out above BTC , altcoins would have completed their runs. (More on that subject here):
We're still some time away from this; meaning that there is still hope for LTC. However, IF LTC can't move PAST these resistance zones I'd have to just face the facts and put it in the same boat as XRP and ADA.
_______________________
BINANCE:LTCUSDT BINANCE:LTCBTC

BITCORN WEEKLY BULLFLAG!!!!! $60-70kForgot to post this with my LTC chart. Here we have the weekly bull flag break out... NUFF SAID. This is not trading advice.

Litecoin Analysis For Roger's Sister-in-Law & Errbody Else! I'm dedicating this chart to my friend Roger's sister-in-law, who I hear is an investor and LTC enthusiast. For her, and the other long-term LTC investors out there, here is my big-picture view of Litecoin.
On the weekly LTC chart, we can see that price is currently in a clear symmetrical triangle (in black.) For those who are unaware, symmetrical triangles are "continuation patterns." That means, they generally produce a continuation of the move from which they began. In this case, the move was CLEARLY to the upside, after LTC broke out of a similar symmetrical triangle in 2017 — just before it's historic run to all time highs.
I have seen a lot of symmetrical triangles, and I have studied them greatly. A couple key things to note about them, is that they usually breakout sometime within the last quarter of the formation. Also, they can somewhat commonly produce false breakouts. What that means, is you could see a symmetrical triangle that (in this case) breaks to the downside, causing a lot of selling, but then recovers into the formation to ultimately produce a sustained breakout to the upside. Another thing to know about symmetrical triangles, is they tend to return to the apex of the triangle to define it as support or resistance. Those qualities aren't very obvious with the first example on the left side of this chart, but I can assure you that they are common qualities of symmetrical triangles.
Looking at the MACD, we can see that it's currently trying to roll over to the downside, as it interacts with the zero line. This is actually a sign of weakness. When the zero line on the MACD acts as resistance, it can project a loss in bullish momentum on the chart. What's interesting, is that LTC has been below the zero line on the MACD for six months. I know you can't really make it out on this chart, but when we look at the MACD during the same period in the first symmetrical triangle, we can see that it was never below the zero line. In fact, it held support on the zero line and stayed above it consistently from June 2015.
With all of that said, just because a symmetrical triangle is typically a "continuation pattern" doesn't mean that it will always act as a continuation pattern. No pattern works 100% of the time. And with the weakness that we're seeing in momentum compared to 2017, it's important to remember that nothing is certain. So, the key takeaway here is that we need to watch for an upside breakout of this symmetrical triangle.
Another good indicator to watch is the RSI. We can see that during the progression of the first symmetrical triangle, the RSI found support above the 43 level, and never dropped below it. At the moment, the weekly RSI is above that level (red horizontal trendline.) However, if we see the RSI fall below that level, especially if it were coupled with a breakdown of the current symmetrical triangle, it would be a clear sign of weakness that is very different from what was seen leading into 2017. One last thing, it's also worth noting that the Gaussian Channel has turned red again, inside of the triangle. While this isn't a huge deal at the moment, it is a bit different than 2017, and it looks a bit weaker.
So, that's my current view on LTC. Good luck everyone.
I'm The Master of The Charts, The Professor, The Legend, The King, and I go by the name of Magic! Au revoir.
***This information is not a recommendation to buy or sell. It is to be used for educational purposes only.***
-JD-

LTC - A lot of potential upside!I like charts like this LTC chart here. It gives a high probability that if we move in a certain direction that we will continue to do so.
If we take the last percentage that LTC went up by and apply that to the next run, we get a hefty move all the way up to almost the $250 area. Maybe that will happen, but a significant resistance point is at $200 where I think we will get a pullback or at least stall at that area.
Weekly MACD = Crossed.
Weekly RSI = Created a higher low and is moving up
The overall chart created a higher low
happy Hodling,
-Sherem

LTC Trends Closer To Potentially Massive SupportHi friends! Welcome to this update analysis on Litecoin! Let's get right to it! Looking at the weekly LTC chart, you can see that price did fall after failing to recover above the 200 week moving average (in purple.)
If you recall from the last analysis, I said "Looking at the immediate price action, you can see that the current price is just below the 200 week MA (in purple.) So, if LTC can't recover above that level, it could produce some downward price movement. However, the bottom of the Gaussian Channel is in the 45.00 range, and the bottom of this proposed channel is just below that."
LTC fell almost exactly to the bottom of the Gaussian channel, printing a low near 46 yesterday. The bottom of the big blue "proposed/possible" channel, is around the 40 level. So, we could definitely see more downside before we see support. On the other hand, LTC has never broken below the Gaussian channel after it turned from green to red, until after the bull run was complete. So, if LTC breaks down below the Gaussian Channel, that would be unusual weakness. If it also breaks down below this proposed blue channel (which I have previously described as atypical and "experimental" in my analyses) LTC could have a more sever correction.
For now, we need to watch to see if LTC can hold these levels, or if it continues to break down below key support. The Gaussian Channel suggests that we could be near an absolute bottom, but price support will have to materialize on the chart for that to be confirmed.
I'm The Master of The Charts, The Professor, The Legend, The King, and I go by the name of Magic! Au revoir.
***This information is not a recommendation to buy or sell. It is to be used for educational purposes only.***
-JD-

Litecoin Breaks Down Below The 50 Week Ma, in Stark Deviation!HI friends! Looking at the weekly LTC chart, you can see that we had a massive breakdown below the 50 week MA (in orange.) If you recall from the last LTC analysis, I showed how LTC was in a similar pattern to the 12345 pattern it made before the explosive move in 2017. So, yes we did break below the moving average, but the week isn't over yet. You can see that there were also breaches of the 50 week MA near the 5 in 2015. However, the weekly candles closed at or above the 50 week MA. So if we see a powerful close below the 50 week here, that will be an ugly deviation from the previous price movement leading into the 2017 bull market.
With that said, we need to see where this weekly candle closes. It's interesting that so many cryptocurrencies are breaking down below major support on their charts at the exact same time. With BTC it's the 21 week MA. With LTC it's the 50 week MA. With XRP it's the rising log channel. There are many others too. What is certain, is that if these important levels aren't recovered, traders should prepare for powerful moves lower. Here on the LTC chart, the line in the sand is the 50 week MA.
I'm The Master of The Charts, The Professor, The Legend, The King, and I go by the name of Magic! Au revoir.
***This information is not a recommendation to buy or sell. It is to be used for educational purposes only.***
-JD-

Litecoin Prints A Bullish Pattern Similar To Pre 2017! (LTC)Hi friends! Welcome to this simple, yet informative, long-term analysis of Litecoin! Let's get right to it! Looking at the weekly LTC chart, we can see that since the all time high, a very similar pattern has developed compared to the early stages of LTC. Beginning at the left side of the chart, you can see that LTC started at a high (1) then fell to a low (2) then rallied above the 50 week MA (in orange) (3) then continued on to make a high (4) then fell back down to the 50 week MA (5.)
When we compare that to what has happened since the ATH, we can see that it is nearly identical. LTC started at a high (1) entered a bear market to a bottom (2) rallied past the 50 week MA (3) continued to a high (4) then fell back to the 50 week MA (5.) If this pattern continues to hold, we should see LTC move slightly higher to sideways, as it continues to hold the 50 week MA before eventually launching to a new all time high.
#PoopLovesYou
I'm The Master of The Charts, The Professor, The Legend, The King, and I go by the name of Magic! Au revoir.
***This information is not a recommendation to buy or sell. It is to be used for educational purposes only.***
-JD-

BTC, GBTC, and yes the one and only LTC chart! You may not like what I have to say... But watch it anyway.
I forgot to mentions Charlie Lee admitted that Devs are leaving
"Just like He did might I add" yet they didn't leave at the top...
Just saying I calls it like I sees it!

Cup & Handle Failing: Add to your LTC BagIt appears the cup and handle we were anticipating didn't play out. Given the bearish divergence on across multiple indicators, I believe leverage traders will begin shorting LTC while its vulnerable. The next two support levels to watch are $125 and $110. If my previous BTC chart plays out (which it has so far), BTC will be making a new high. Once we hit $11.6 k, I believe LTC will dip to the first support level at $125. This is consistent with the support highlighted above in the BTC/LTC chart. We should roughly be at 0.011 at that point.
My Plan:
1) I've already converted LTC to BTC
2) Entered in a stop loss for BTC -- If BTC doesn't maintain its current pennant structure, everything gets slaughtered. This way I protect my USD gains.
3) Created a buy order around 0.011
4) Even if we go lower than 0.011 -- I'm ok with it because I've added to my LTC bag
5) Depending on how fast LTC breaks down and where it finds support, I may convert additional BTC to LTC -- Strong bullish sentiment overall, it could hit $160-170 on next break out
With the strategy outlined above I'll protect all the gains I've made in the last two weeks, but also have an opportunity to capitalize on potential moves up.
On a side note I'm also watching OMG and MONA for a potential break outs.

LTC Repeating???I am extremely new to TA but I made this LTC chart last night after noticing some similarities between the previous and current trends. I do not know how the halving may affect this but I have charted a short target based on the proportions from September-February chart and the current trend. Any feedback is much appreciated as I am new and want to learn.
